Building a Sumo Logic Dashboard for a Rails App on Heroku
Note: The dashboard and graphs outlined in this article are simplified examples of what I have used successfully in a production environment in the past. You should modify the dashboard and queries to fit your application’s specific needs.
 You can download the JSON config to import this dashboard for your own application.
Overview
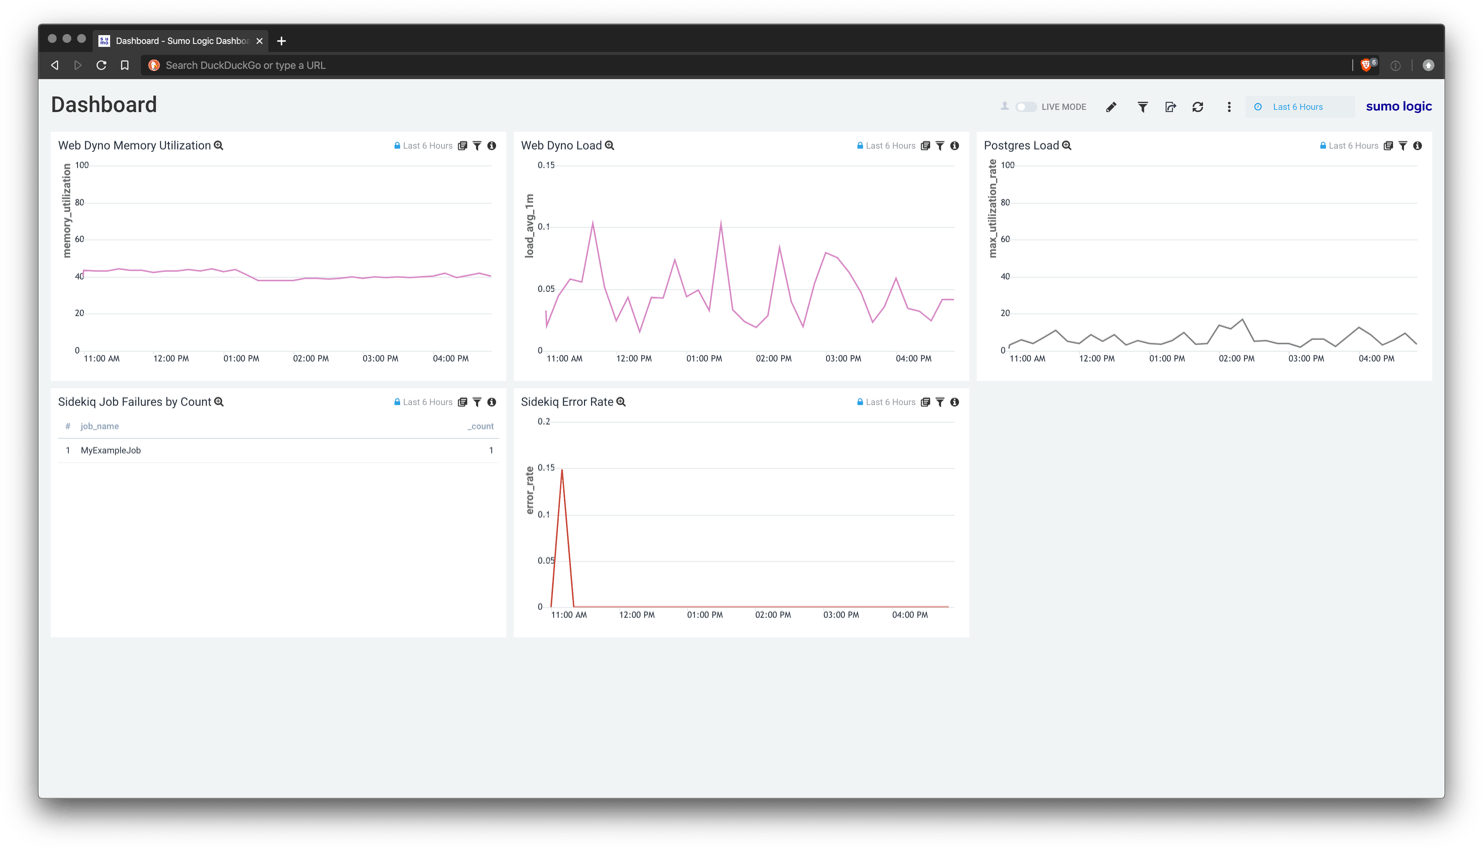
Our goal is to create a Sumo Logic dashboard that we can use to help us identify trends and problems with the performance of our Heroku Ruby on Rails application.
To do this we are going to focus on a few key areas:
- Rails Application (Web Dynos)
- Web dyno load1
- Web dyno memory utilization
- Heroku Postgres
- Postgres load2
- Worker Dynos and Sidekiq Jobs
- Sidekiq worker error rate
- Sidekiq worker failures by job
In order to build dashboards for these different areas, we first need to consider what kinds of logs Heroku makes available.
-
Heroku runtime dyno performance logs (e.g. CPU, memory usage) are available if you enable the Heroku Labs
log-runtime-metricsfeature.$ heroku labs:enable log-runtime-metrics -
Heroku Postgres logs are available by default for Heroku Postgres Standard and Premium Tier databases.
-
Sidekiq logs are available by default as standard application logs from worker dynos.
Sumo Logic Graph Implementations
Some things to note with the implementations below:
- All queries timeslice with buckets: This is done so that the time period can be changed on the dashboard and the graphs auto adjust their precision accordingly.
- All queries omit application specific filters: This is done so that the dashboard can be applied to any application with a SumoLogic Dashboard Filter.
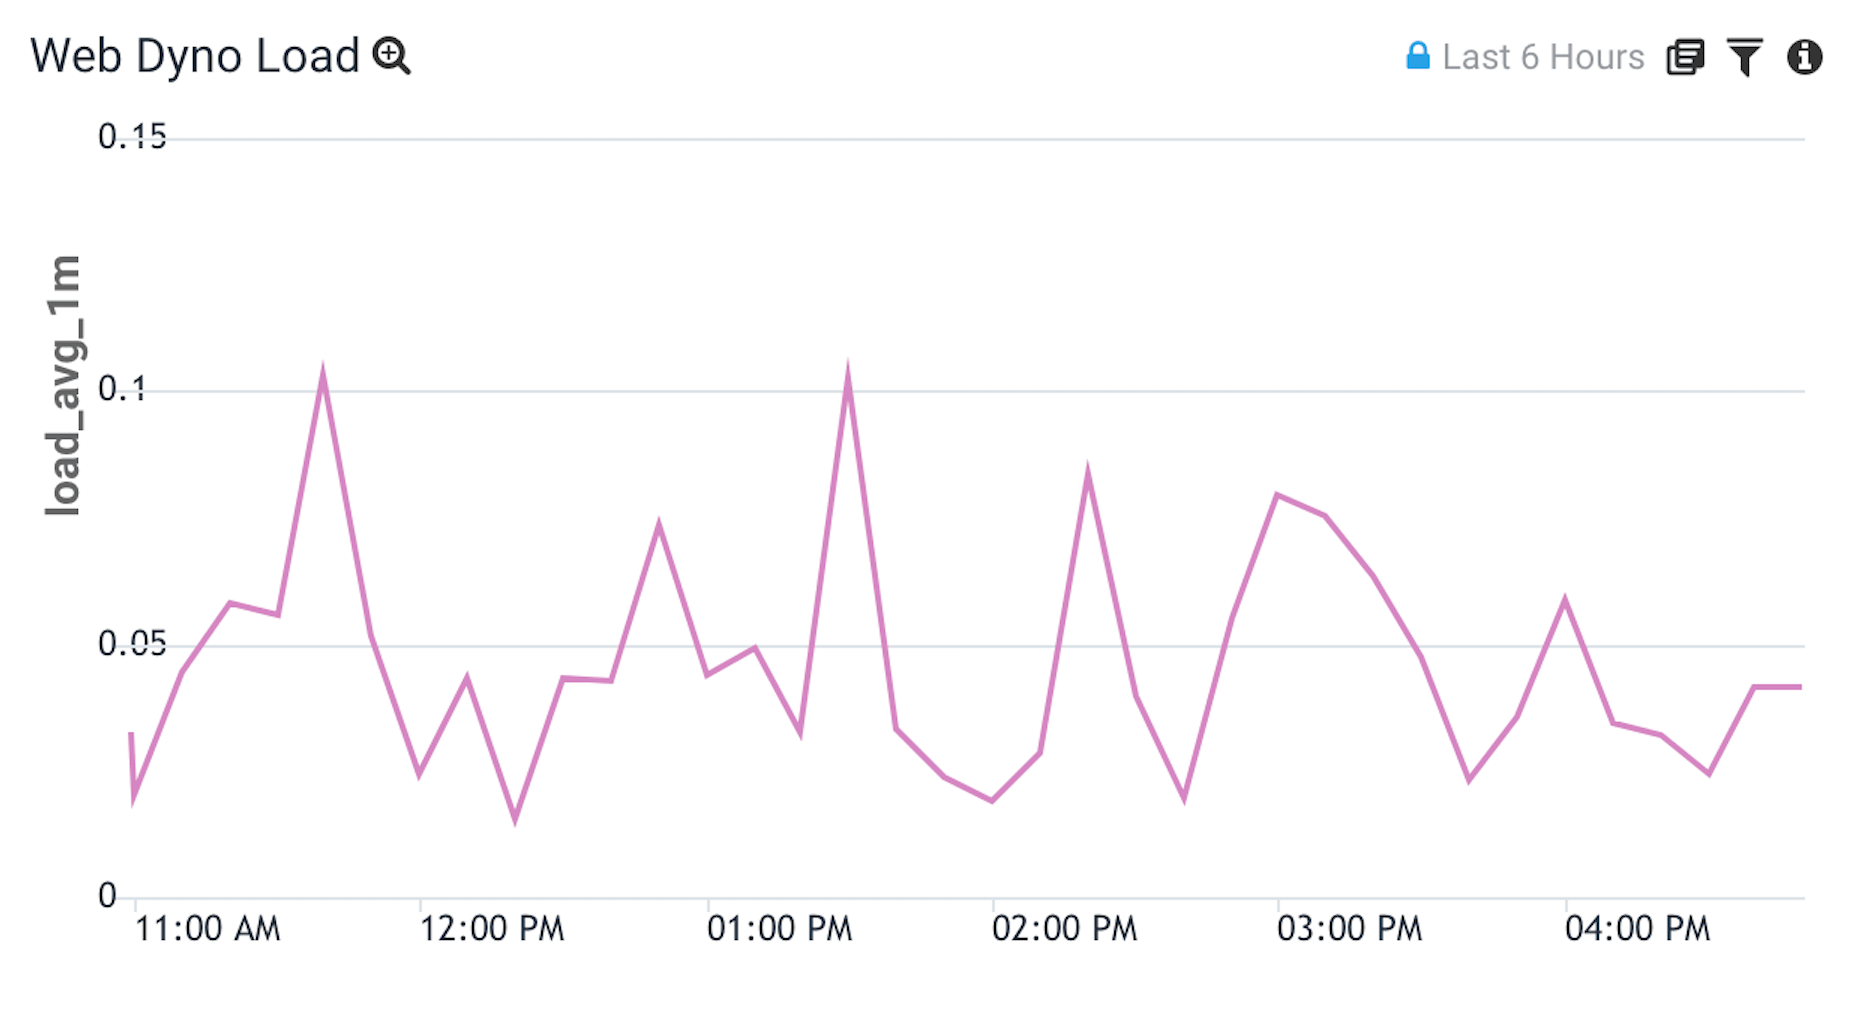
Heroku Web Dyno Load
This graph is designed to help provide insight into the CPU usage for you application. It uses Heroku’s CPU load average calculation which, in my experience, is mostly useful to identify relative spikes in load.
Graph
Logs
$ heroku logs --dyno web --source heroku --app my-app | grep load_avg | head -1
2020-01-28T23:59:31.883407+00:00 heroku[web.1]: source=web.1 dyno=heroku.93034875.4635d2a8-08be-4bf5-93c8-aed05a2fda5c sample#load_avg_1m=0.00 sample#load_avg_5m=0.00 sample#load_avg_15m=0.01
Query
"source=web."
| parse "sample#load_avg_1m=* " as load_avg_1m
| timeslice 60 buckets
| avg(load_avg_1m) as load_avg_1m by _timeslice
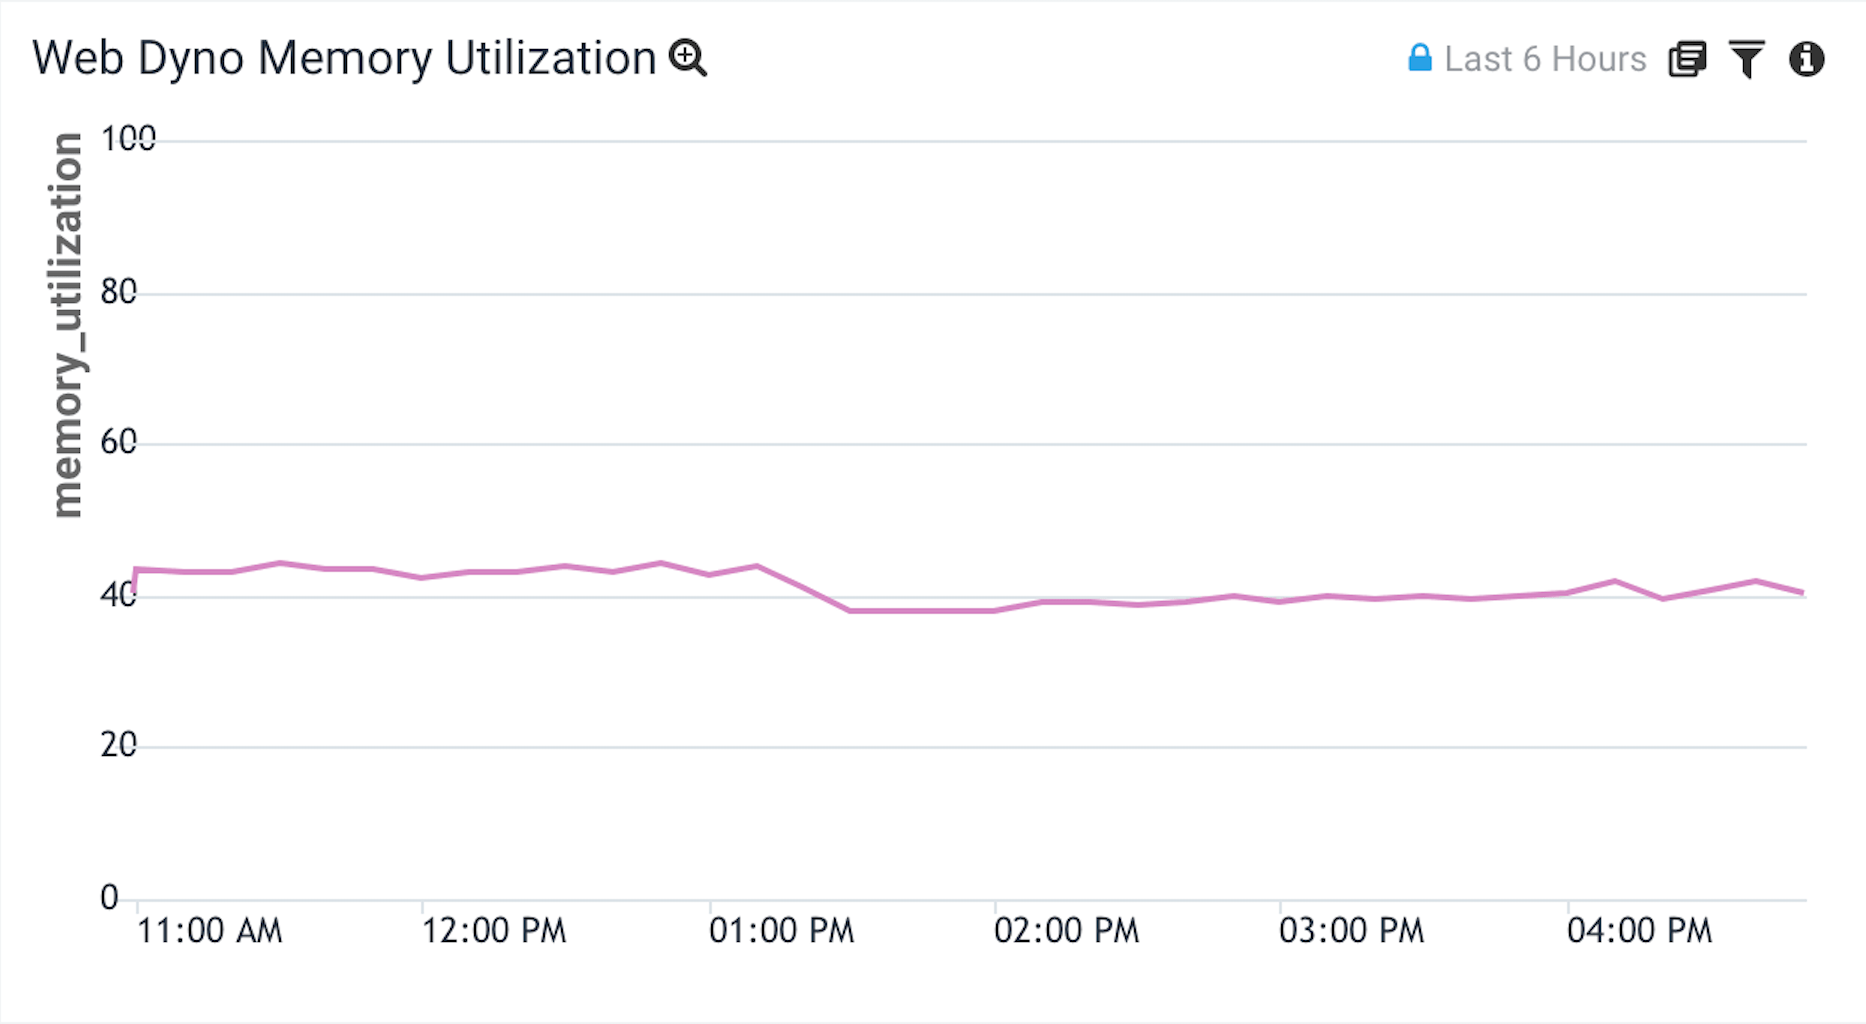
Heroku Web Dyno Memory Utilization
This graph is designed to help identify your application’s utilization of the available memory.
Graph
Logs
$ heroku logs --dyno web --source heroku --app my-app | grep memory | head -1
2020-01-29T00:02:49.243705+00:00 heroku[web.1]: source=web.1 dyno=heroku.93034875.4635d2a8-08be-4bf5-93c8-aed05a2fda5c sample#memory_total=338.52MB sample#memory_rss=252.74MB sample#memory_cache=85.79MB sample#memory_swap=0.00MB sample#memory_pgpgin=5641245pages sample#memory_pgpgout=5554583pages sample#memory_quota=512.00MB
Query
"source=web."
| parse "sample#memory_rss=*MB" as memory_rss
| parse "sample#memory_quota=*MB" as memory_quota
| timeslice 60 buckets
| max(memory_rss) as max_memory_rss, max(memory_quota) as max_memory_quota by _timeslice
| max_memory_rss / max_memory_quota * 100 as memory_utilization
| fields _timeslice, memory_utilization
In this query we divide the Resident Memory (memory_rss) by the Memory Quota (memory_quota) to get a maximum memory utilization rate for our dynos.
At the end of the query we do a fields _timeslice, memory_utilization so that memory_rss and memory_quota don’t show up in our graph.
- Resident Memory (
memory_rss): The portion of the dyno’s memory (megabytes) held in RAM. - Memory Quota (
memory_quota): The resident memory (memory_rss) value (megabytes) at which Heroku triggers an R14 error.
Read more about the fields Heroku includes for memory consumption.
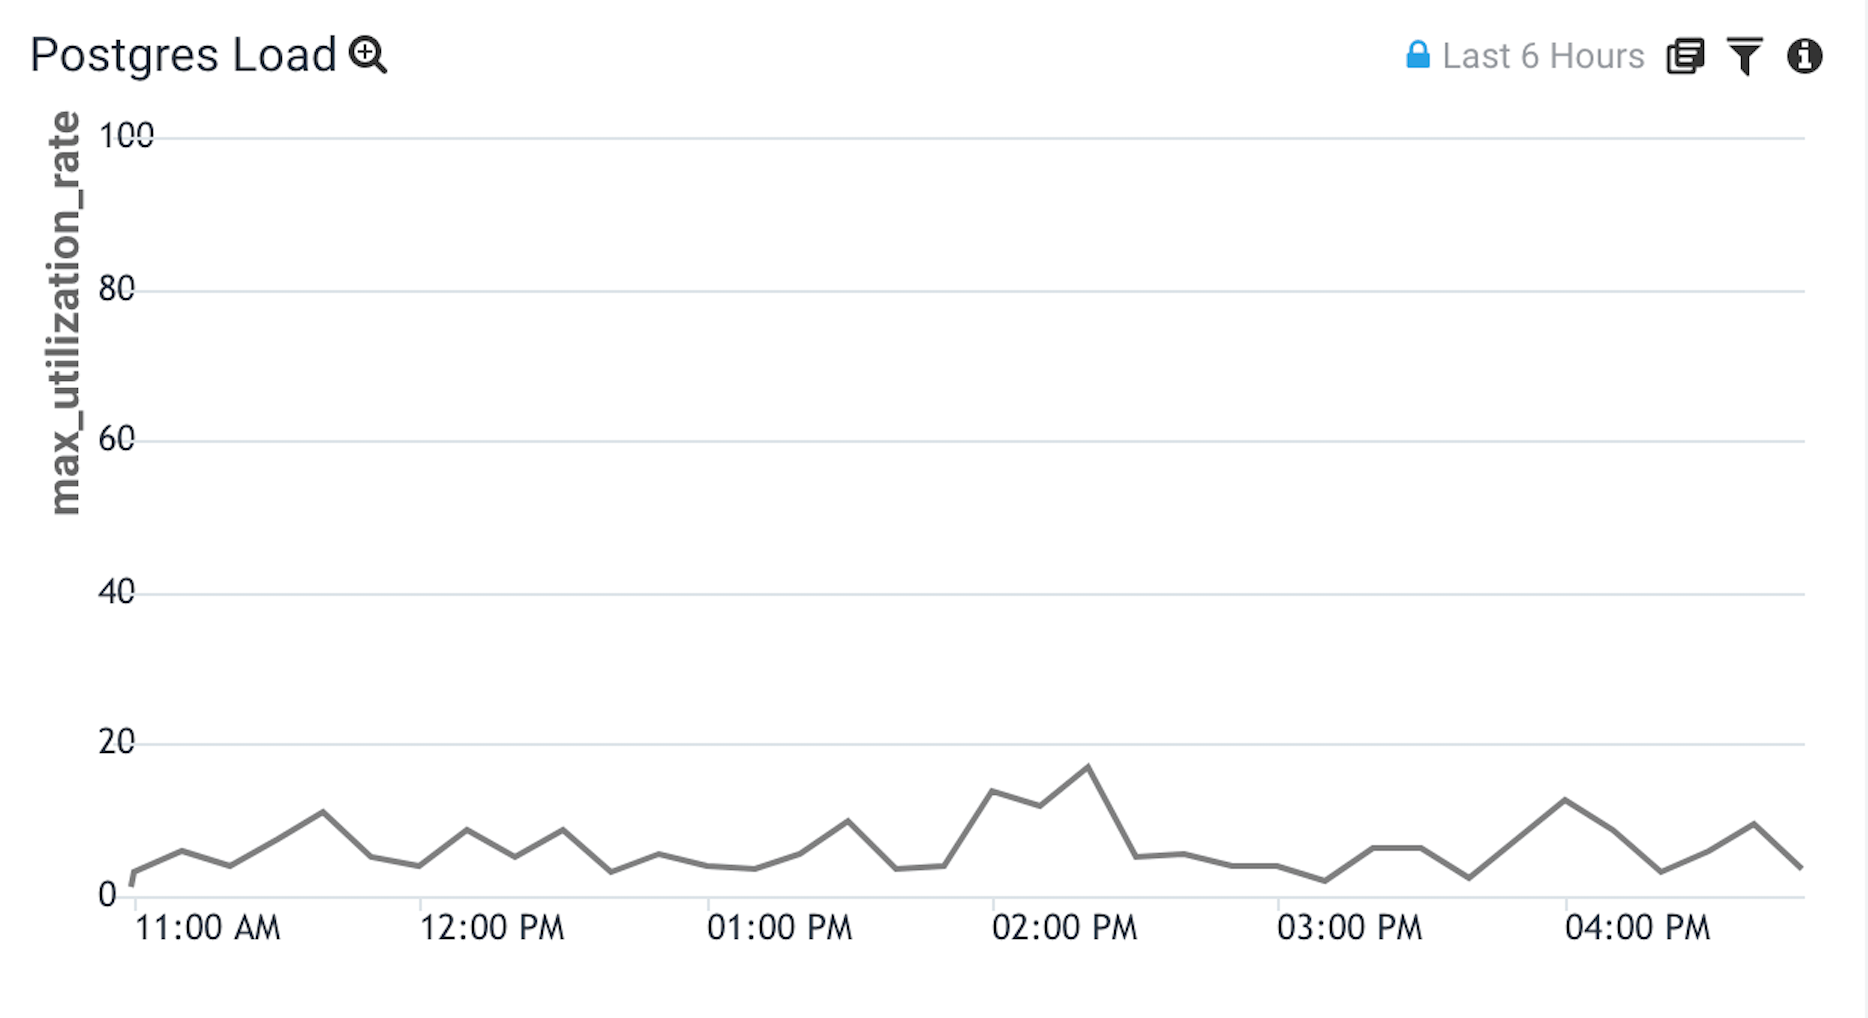
Heroku Postgres Load
This graph is designed to help identify if your Postgres database is CPU-bound.
Graph
Logs
$ heroku logs --dyno heroku-postgres --app my-app | head -1
2020-01-29T00:36:10+00:00 app[heroku-postgres]: source=HEROKU_POSTGRESQL_RED addon=postgresql-aerodynamic-12345 sample#current_transaction=1012345 sample#db_size=3743972487bytes sample#tables=10 sample#active-connections=8 sample#waiting-connections=0 sample#index-cache-hit-rate=0.99682 sample#table-cache-hit-rate=0.84557 sample#load-avg-1m=0 sample#load-avg-5m=0 sample#load-avg-15m=0 sample#read-iops=0 sample#write-iops=0.12397 sample#tmp-disk-used=33849344 sample#tmp-disk-available=72944943104 sample#memory-total=4044932kB sample#memory-free=78976kB sample#memory-cached=3700368kB sample#memory-postgres=23292kB
Query
"heroku-postgres"
| parse "source=* " as db_name
| parse "sample#load-avg-1m=* " as load_avg_1m
| (load_avg_1m / 1) * 100 as utilization_rate
| timeslice 60 buckets
| max(utilization_rate) as max_utilization_rate by _timeslice
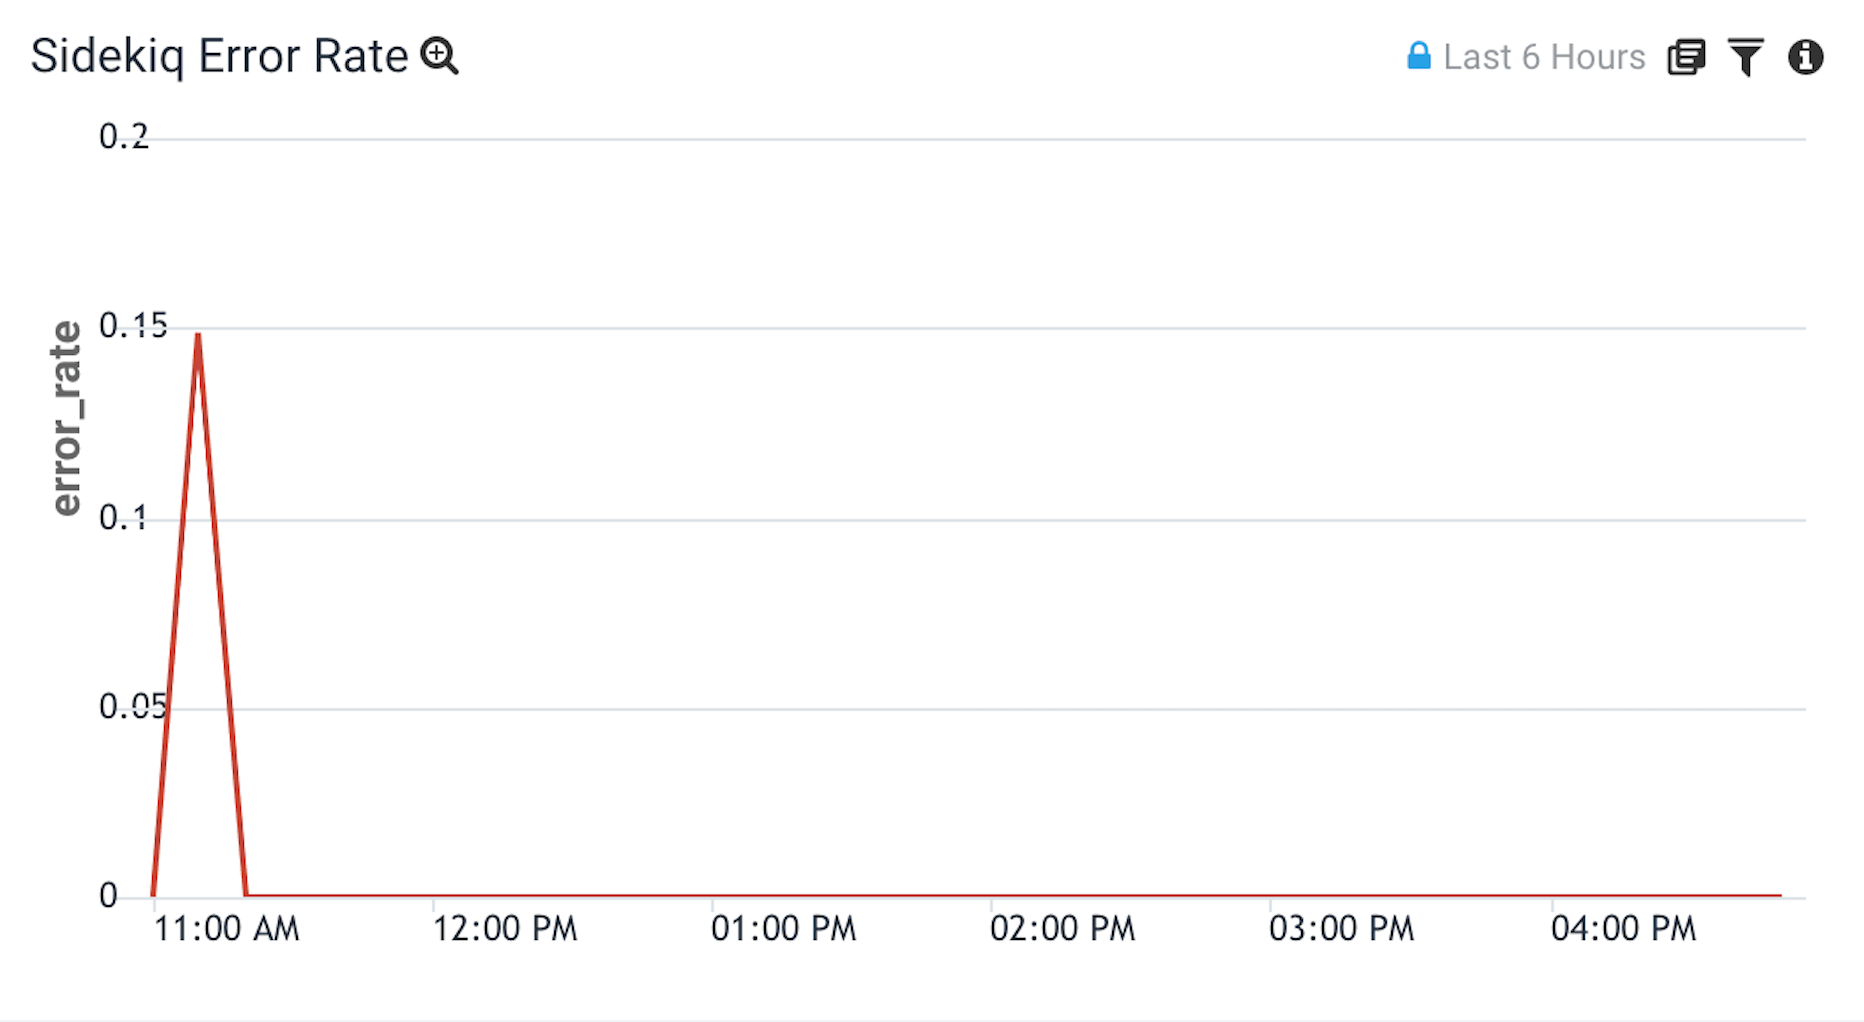
Sidekiq Error Rate
This graph is designed to give you insight into your frequency of failed Sidekiq jobs over time.
Graph
Logs
$ heroku logs --source app --dyno worker --app my-app | grep MyExampleJob
2020-01-26T09:02:44.353201+00:00 app[worker.1]: pid=4 tid=6bjk class=MyExampleJob jid=b027792cdb4a453576377c69 elapsed=10.576 INFO: done
2020-01-26T09:02:33.777529+00:00 app[worker.1]: pid=4 tid=6bjk class=MyExampleJob jid=b027792cdb4a453576377c69 INFO: start
2020-01-26T09:02:07.485427+00:00 app[worker.1]: pid=4 tid=5si0 class=MyExampleJob jid=b027792cdb4a453576377c69 elapsed=44.526 INFO: fail
2020-01-26T09:01:22.959446+00:00 app[worker.1]: pid=4 tid=5si0 class=MyExampleJob jid=b027792cdb4a453576377c69 INFO: start
Query
"host app worker."
| parse "elapsed=* INFO: *" as run_time, status
| if (status = "fail", 100, 0) as unsuccessful
| timeslice 60 buckets
| avg(unsuccessful) as error_rate by _timeslice
In this query we filter for the Sidekiq logs that represent a job being successful or failing. From those logs, we assign the successful messages a value of 100 and assign the failure messages a value of 0. Finally, we take the average of all of those logs to get an error rate out of 100%.
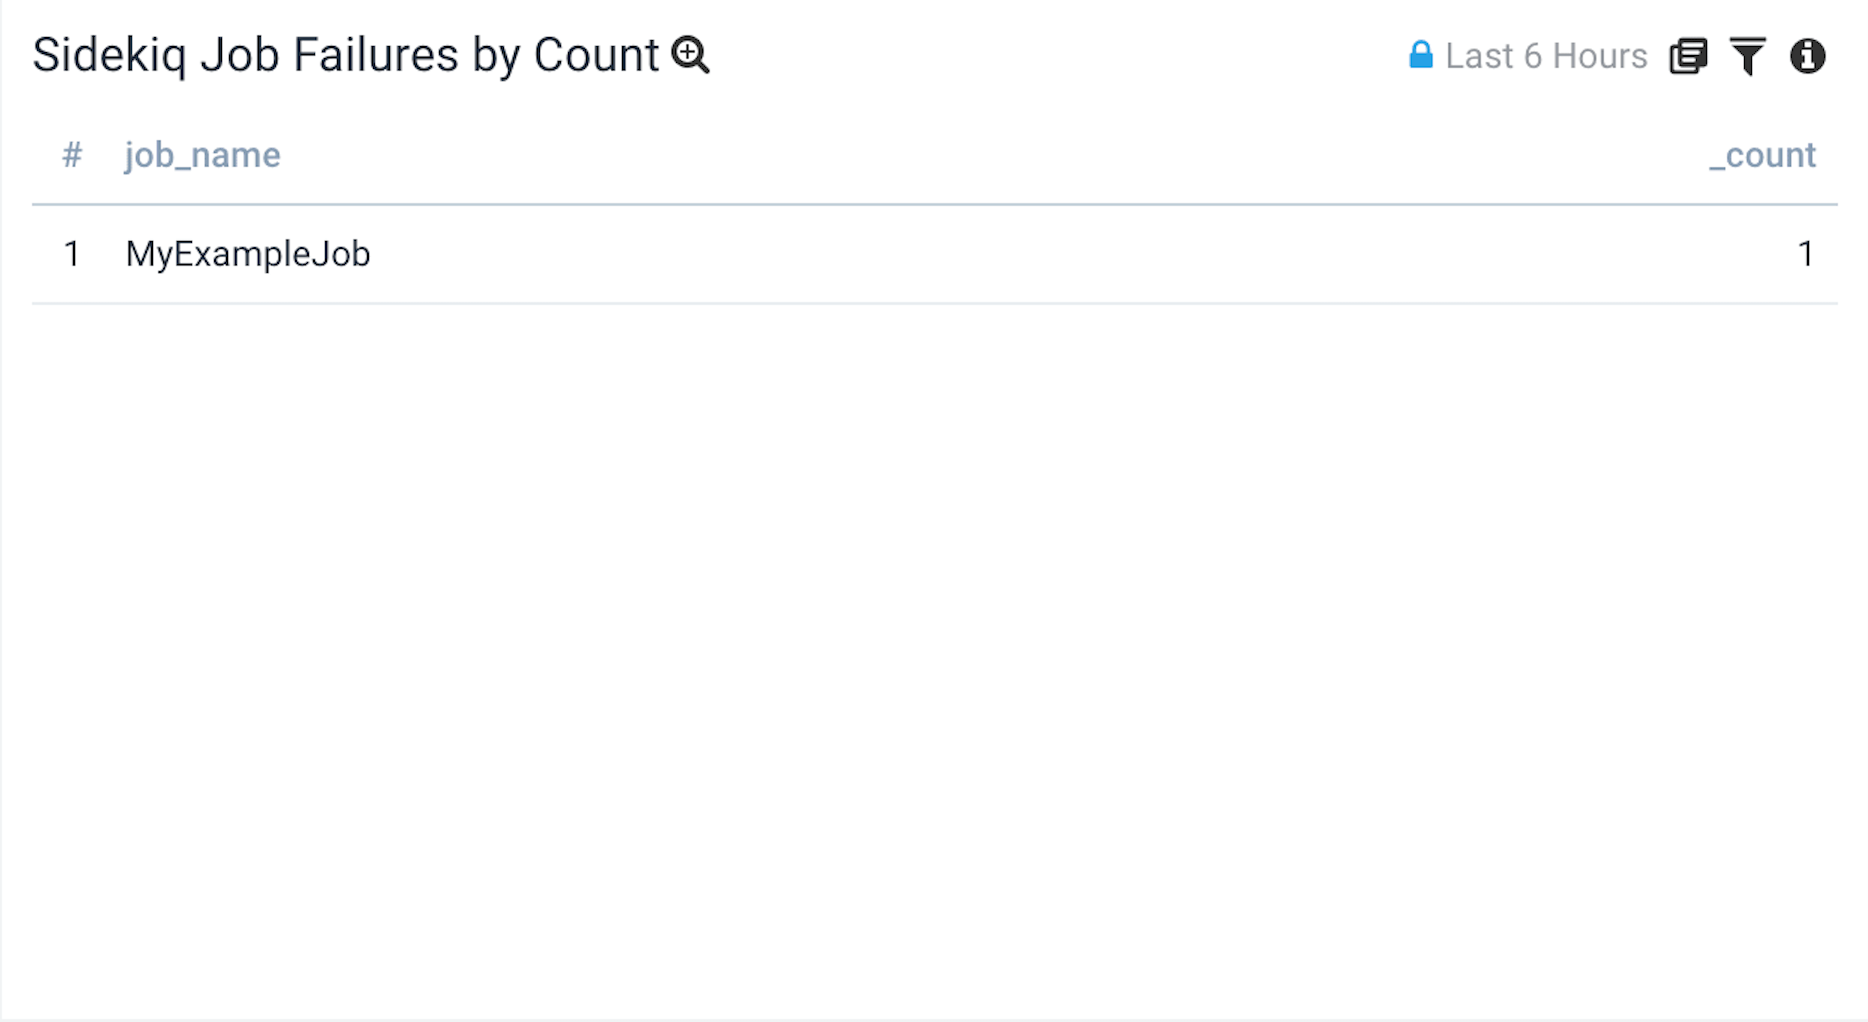
Sidekiq Job Failure Count by Class
This table is designed to work with the Error Rate graph to help quickly identify which jobs are contributing to the error rate.
Graph
Logs
$ heroku logs --source app --dyno worker --app my-app | grep MyExampleJob
2020-01-26T09:02:44.353201+00:00 app[worker.1]: pid=4 tid=6bjk class=MyExampleJob jid=b027792cdb4a453576377c69 elapsed=10.576 INFO: done
2020-01-26T09:02:33.777529+00:00 app[worker.1]: pid=4 tid=6bjk class=MyExampleJob jid=b027792cdb4a453576377c69 INFO: start
2020-01-26T09:02:07.485427+00:00 app[worker.1]: pid=4 tid=5si0 class=MyExampleJob jid=b027792cdb4a453576377c69 elapsed=44.526 INFO: fail
2020-01-26T09:01:22.959446+00:00 app[worker.1]: pid=4 tid=5si0 class=MyExampleJob jid=b027792cdb4a453576377c69 INFO: start
Query
"host app worker."
| parse "class=* " as job_name
| parse "elapsed=* INFO: *" as run_time, status
| where status = "fail"
| count by job_name
| order by _count
-
CPU load average is a very complicated calculation that I’ve found to only be useful relative to itself overtime. The calculation uses an exponentially damped moving average of the number of runnable tasks from the previous 30 minutes. Read more here. ↩
-
Postgres load average is calculated differently than how Heroku CPU load average for dynos. It is the average system load (for a 1, 5, or 15 min period) divided by the number of available CPUs. ↩