Finding and Fixing Missing Indexes in a Rails app
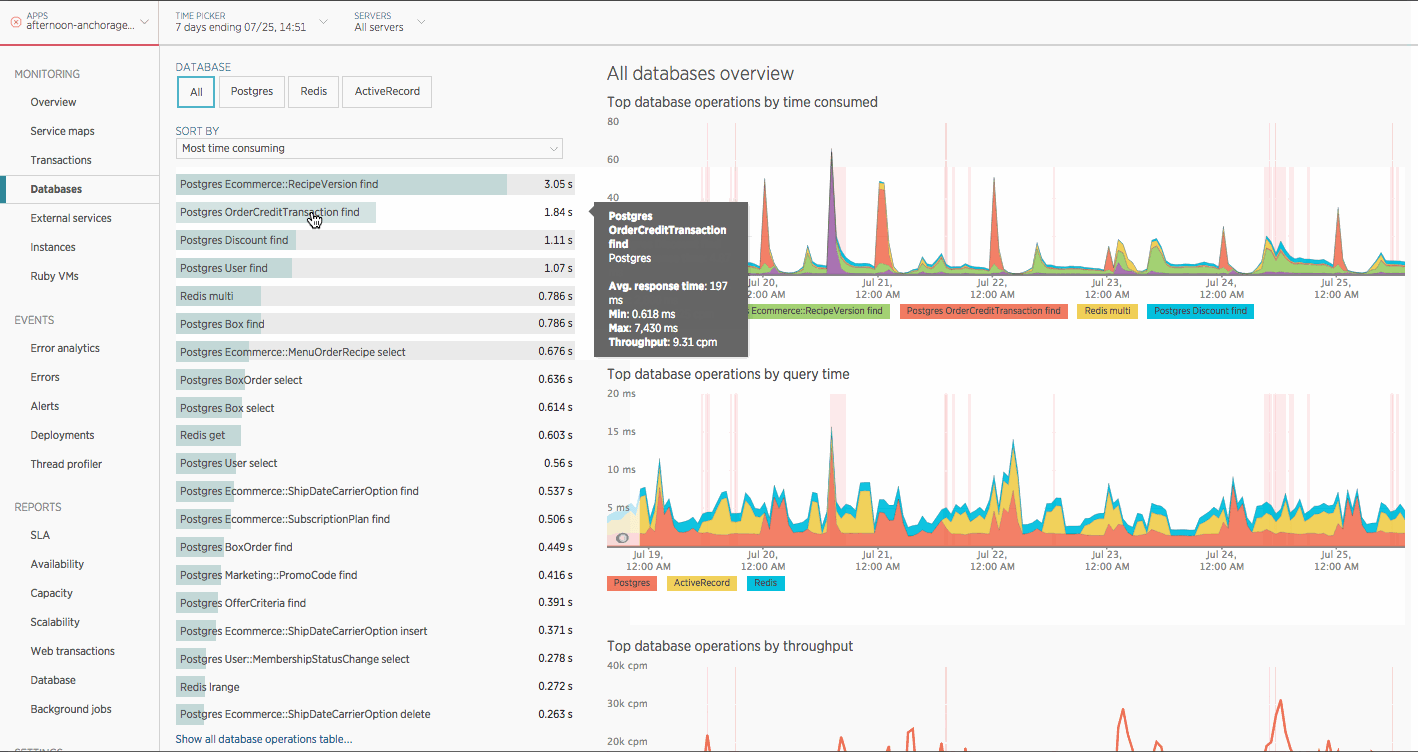
When looking at the “Most time consuming” database operations for our application in New Relic and I came across something that looked odd to me.
Looking at the list I noticed two operations that I wouldn’t have expected to be among the most time consuming: OrderCreditTransaction find and Discount find.
In this post we’re going to dig into OrderCreditTransaction find find the problem and fix it.
What does “Most time consuming” mean?
“Most time consuming” tells you how much total time was spent doing an operation in a minute. This is equivalent to the average throughput (number of calls/minute) multiplied by the average response time.
For example if User find has an average response time of 4.71 ms and an average throughput of 743 cpm then it would consume: 4.71 ms * 743 cpm = 3.5 seconds
So this means that out of all database operations our application is spending the second most time in OrderCreditTransaction find. And, in order for that to be the case, it’s either being called a ton (high cpm), has a slow response time, or some combination.
Let’s dig in and find out.
Determining the problem
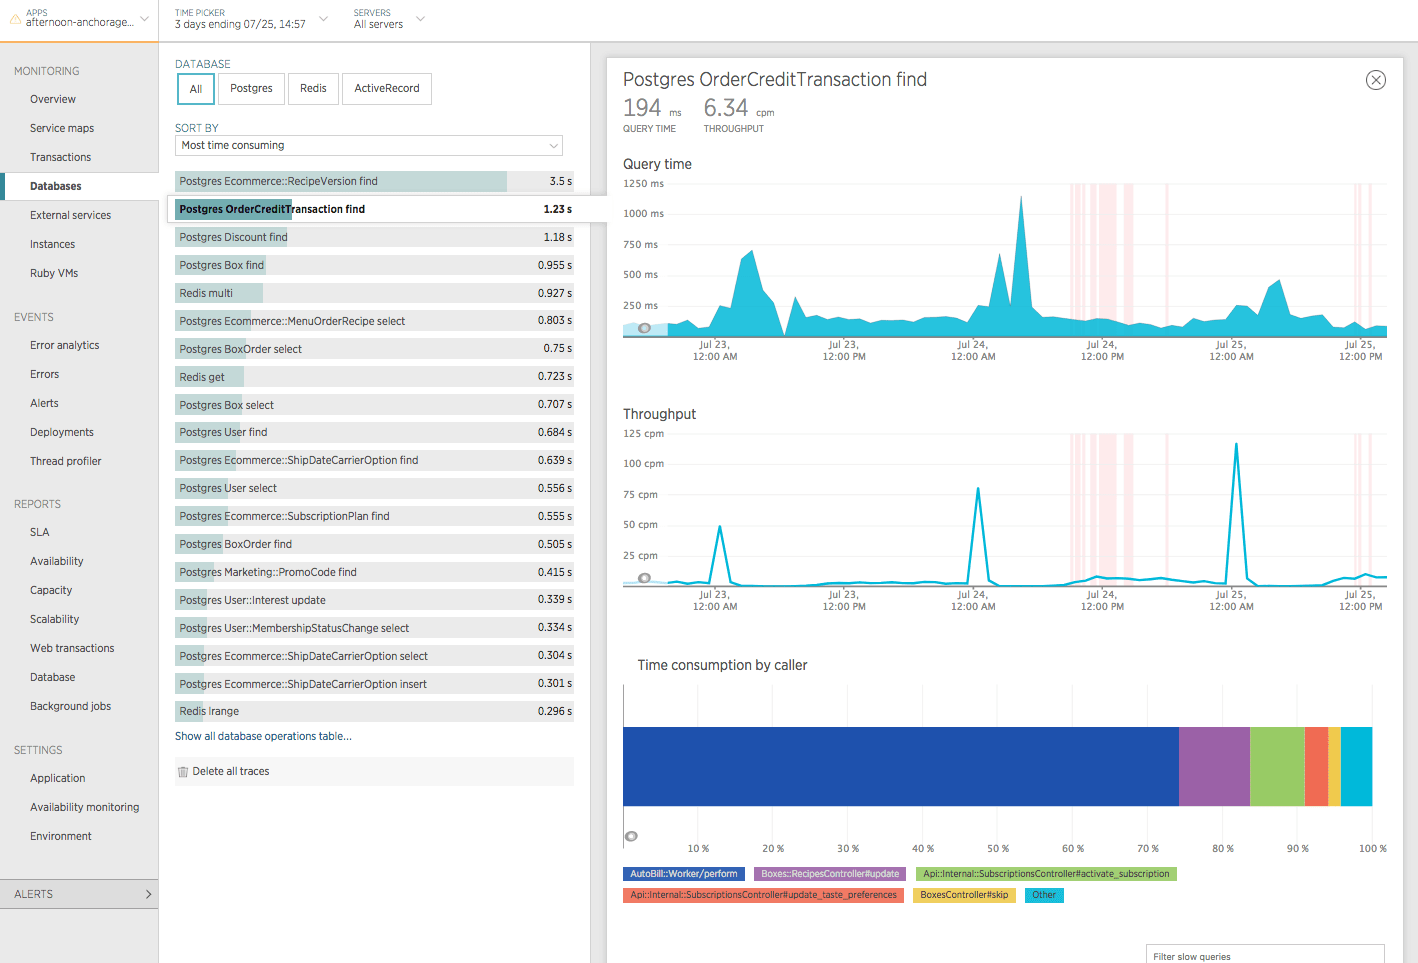
First let’s take a look at the OrderCreditTransaction find database operation by itself. Upon inspecting this operation you’ll notice it has relatively low throughput (~6.34 cpm) and a pretty slow avg response time (~196 ms).
This seems to indicate that the problem is likely related to response time and not throughput.
Let’s scroll down and see what some of the slow queries are…
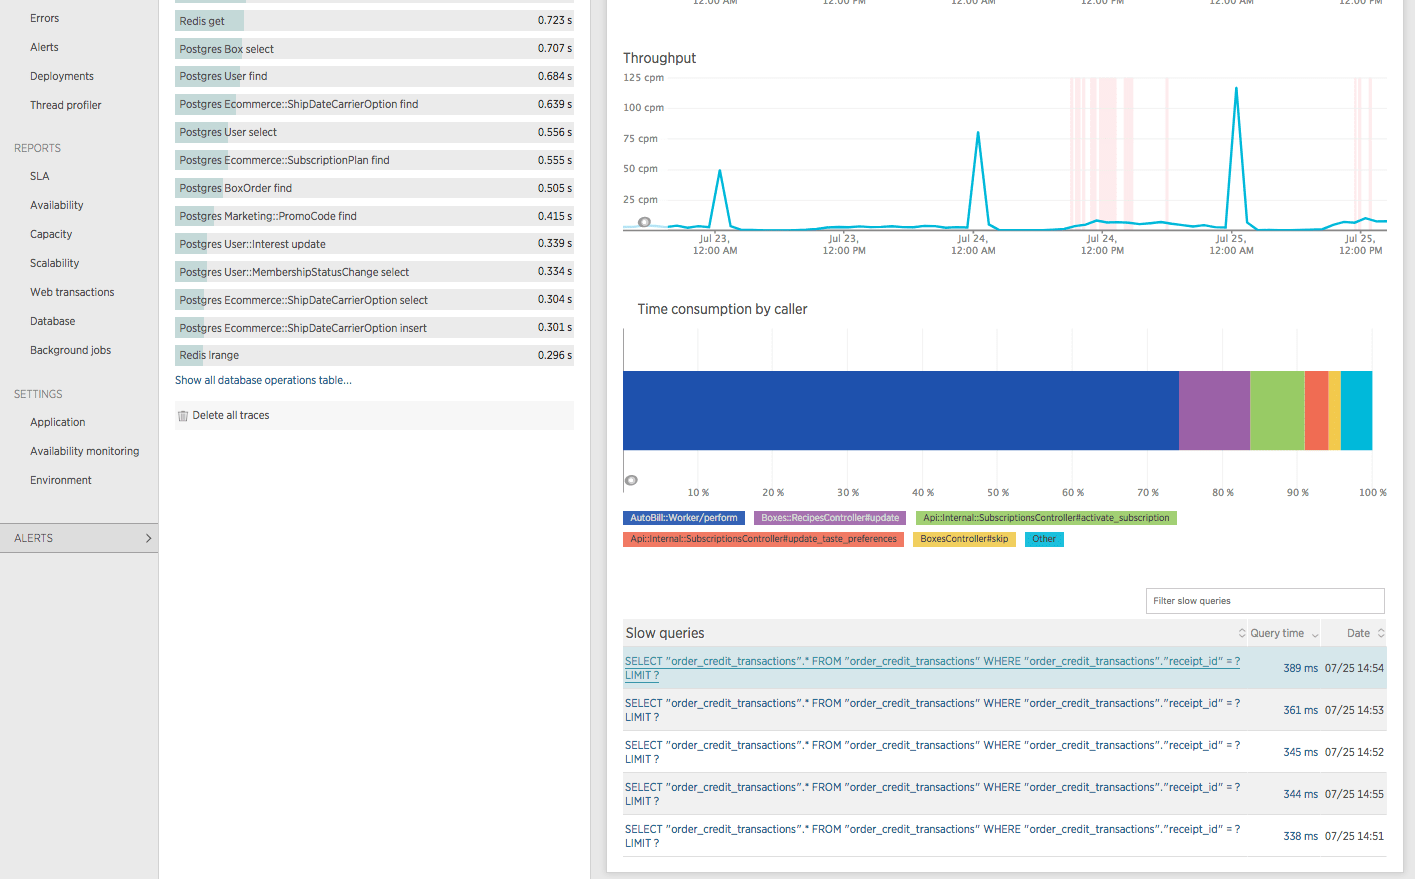
Interesting! It looks like some simple SELECT queries filtering on receipt_id are taking up to almost 400ms! That seems like we could be a missing index… Let’s verify by clicking on one of those “Slow queries” and looking at an EXPLAIN.
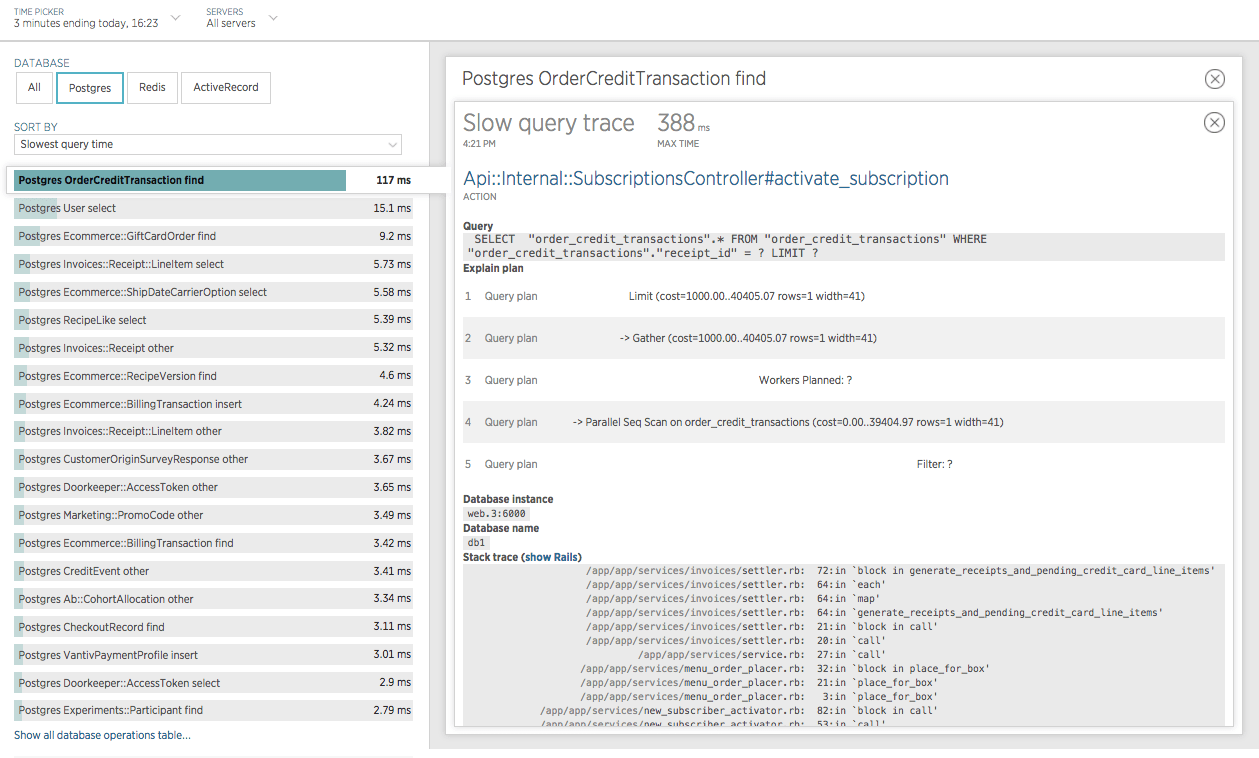
If we look at line 4 of the Explain plan we can see that Postgres is doing a Parallel Sequential Scan on the order_credit_transactions table; this means that before this query can return it must look at every single record in the table (which at the time of this writing is 3,320,909 records). This seems to confirm our missing index theory!
Now, let’s take a look at our codebase and verify that an index is missing.
First off, let’s take a look at the order_credit_transactions table in schema.rb:
create_table "order_credit_transactions", force: :cascade do |t|
  t.integer  "order_id"
  t.integer  "receipt_id"
  t.datetime "created_at",                     null: false
  t.datetime "updated_at",                     null: false
end
Aha! It looks like there is no index on the receipt_id column!
Ideally, at this point (before we add any new indexes) we would want to confirm the behavior we saw from the EXPLAIN in New Relic on our local machine so that we can understand how the query plan will change once we introduce the new index (and confirm that our change will actually fix the problem).
We can do this by firing up a rails console locally and running something like this:
OrderCreditTransaction.where(receipt_id: 1).explain
This will run an EXPLAIN on your local database for the generated query.
However, there is a problem with this. Running this locally may give us a meaningfully different result that what we saw in production - this is because Postgres dynamically creates query plans depending on several factors, some of which are different between our local environment and production (most notably the number of records in the table).
To address this we could take some time to first copy some of the relevant data from production to our local machine and then run our EXPLAIN. But, in this case, we had a very high degree of certainty that this was the issue so we decided that the effort involved in doing that was not worth it.
Fixing the problem
Now, let’s add the missing index and make sure that we do it concurrently to ensure there is minimal to no performance impact to the table while the index is being built.
Rails doesn’t provide a way to cleanly generate a migration that adds an index to an existing column concurrently, so this needs to be a three step process.
First we generate an empty migration, then we manually edit the migration as outlined below, and finally we run the migration, commit and deploy.
$ bin/rails g migration AddIndexToOrderCreditTransactions
class AddIndexToOrderCreditTransactions < ActiveRecord::Migration[5.0]
  disable_ddl_transaction!

  def change
    add_index :order_credit_transactions, :receipt_id, algorithm: :concurrently
  end
end
$ bin/rails db:migrate
Verifying our fix
After the code gets merged and we run the migrations on staging and production let’s make sure we actually fixed the problem.
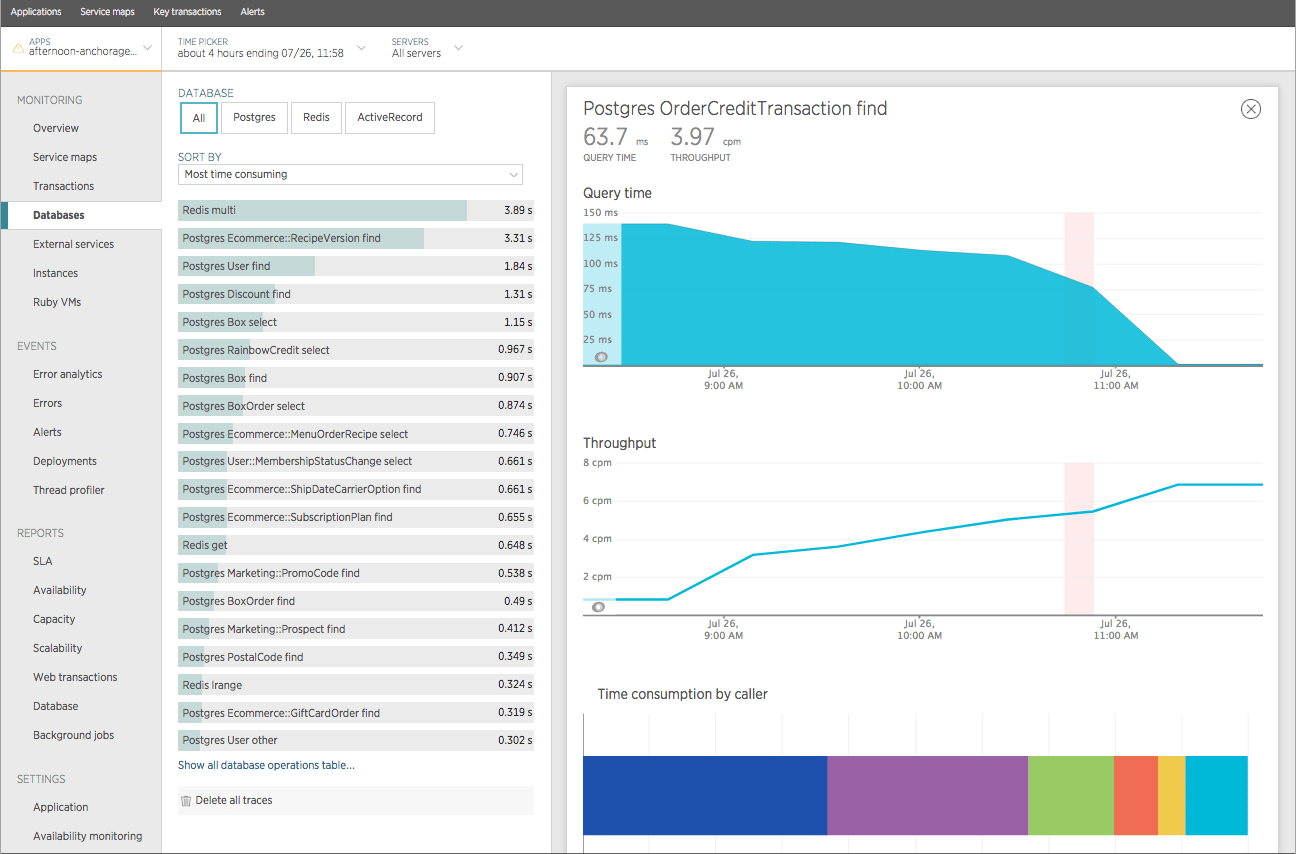
Woah! Looks like it worked. After deployment (around 11am) the average query time dropped from an average response time of ~196 ms to ~1 ms. That is a 99.49% decrease in response time!
Finally, let’s take a look a couple days after deployment to make sure that everything still looks good.
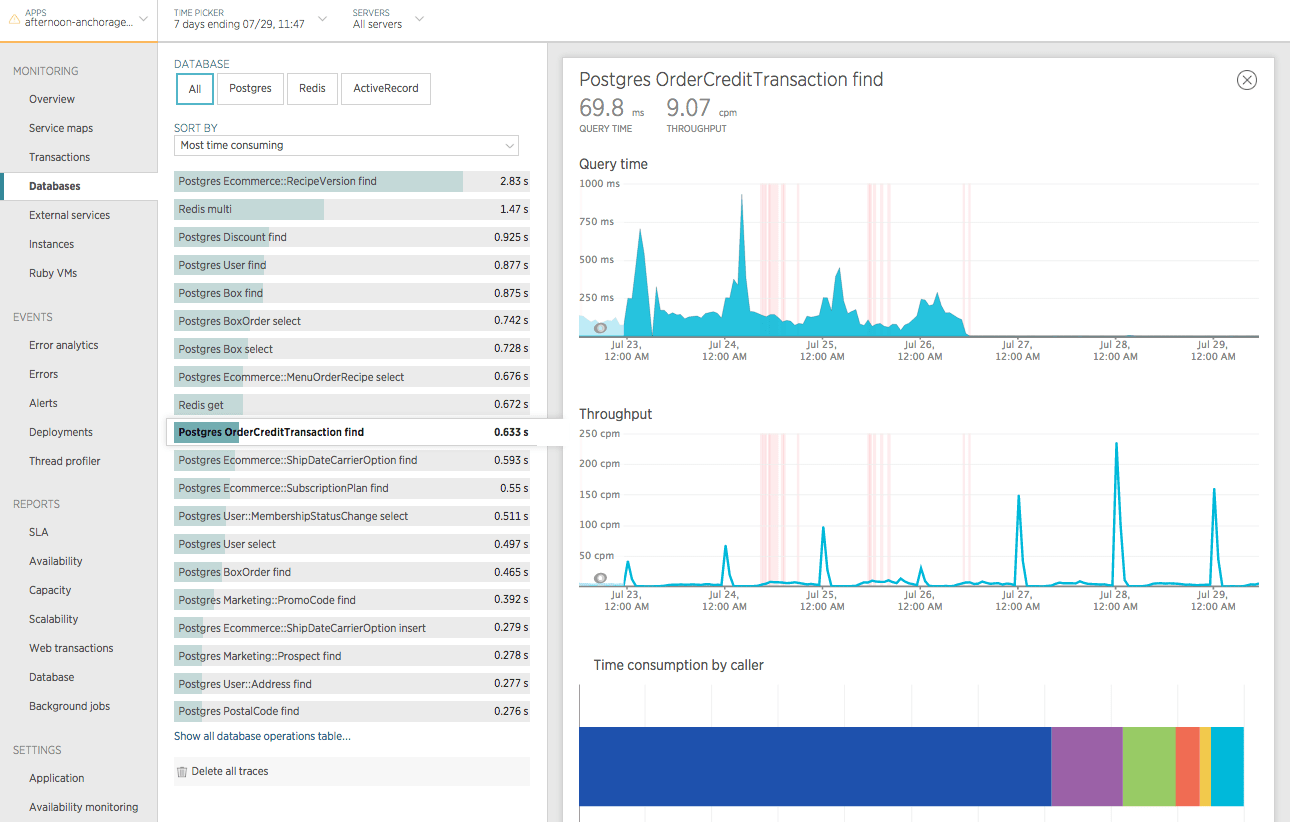
It still looks good!
Also, it’s no longer one of the most time consuming queries and it looks like it’s going to continue to fall down on that list!